Graphing activities in the Montessori casa classroom provide children with the opportunity to collect data and organize it in many different ways. These activities also introduce the children to statistics (data analysis) and probability.
We chose to do one of our graphs about the different types of weather that we experienced in March.

Our question was Which Do You Like Best?
Our choices were:

Snowy

Rainy

Sunny

Windy
Each child wrote their name on a piece of paper and placed it underneath the type of weather that they liked best.


When everyone had placed their name on our graph, we all discussed the results.
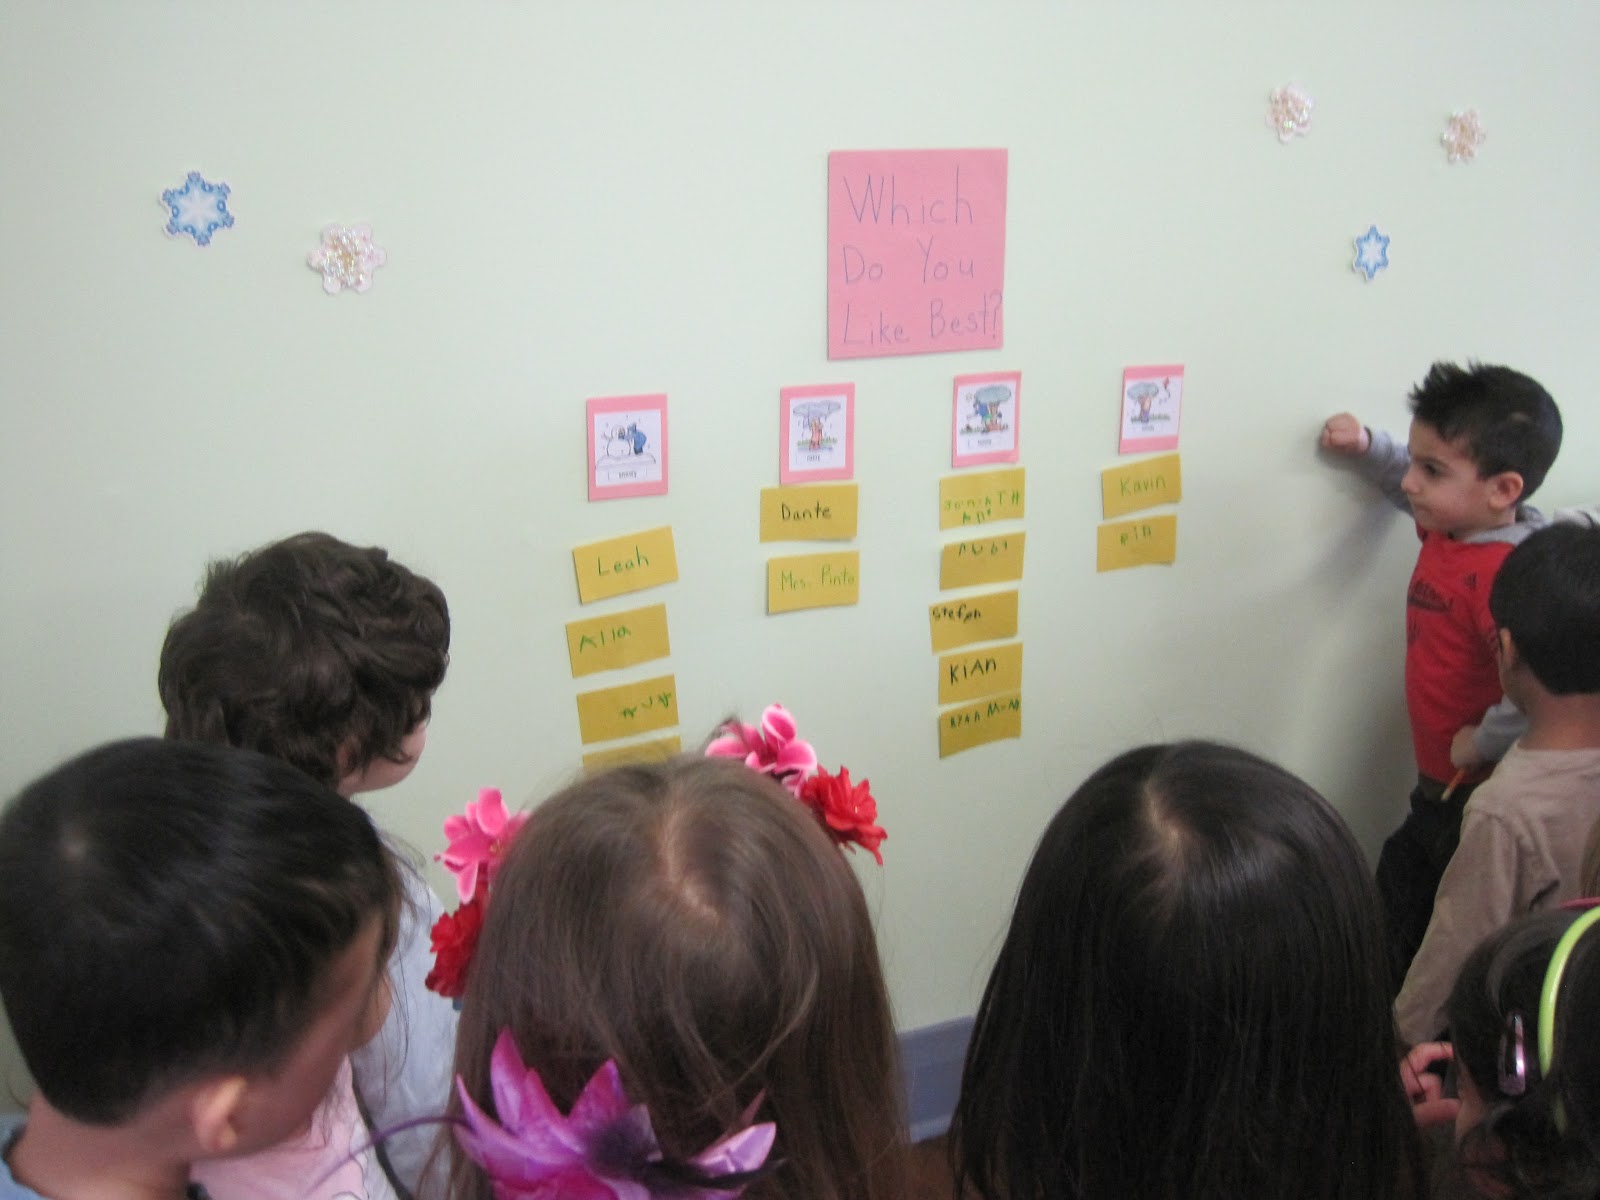
Snowy weather was the type of weather that the children liked best, followed by sunny, with windy and rainy tied for last place.

Through our graph, the children were able to:
~ collect information
~ count and sort
~ read graphs
~ make observations from a graph
~ ask questions about graph results
Over the next few months the children will be creating and analyzing more graphs. Our soon to be graduates are looking forward to creating a graph and collecting data from their fellow classmates.
No comments:
Post a Comment